Statistics
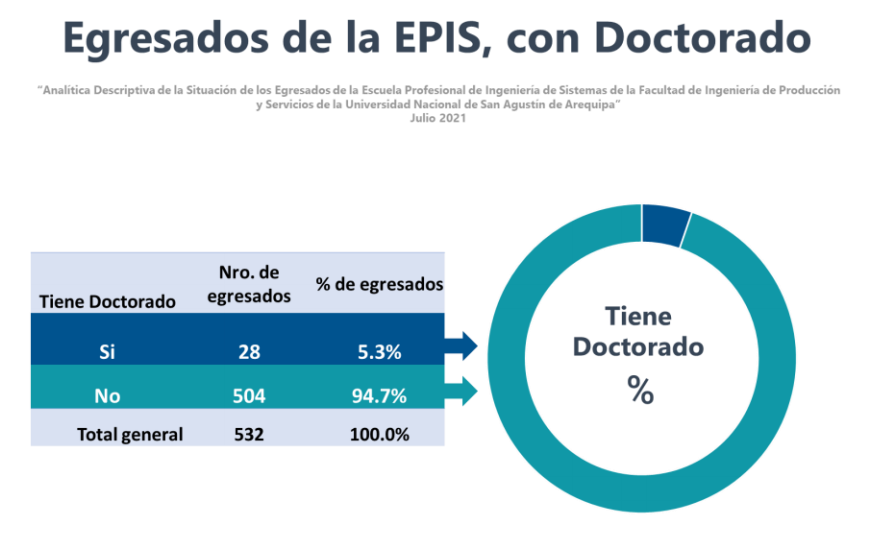
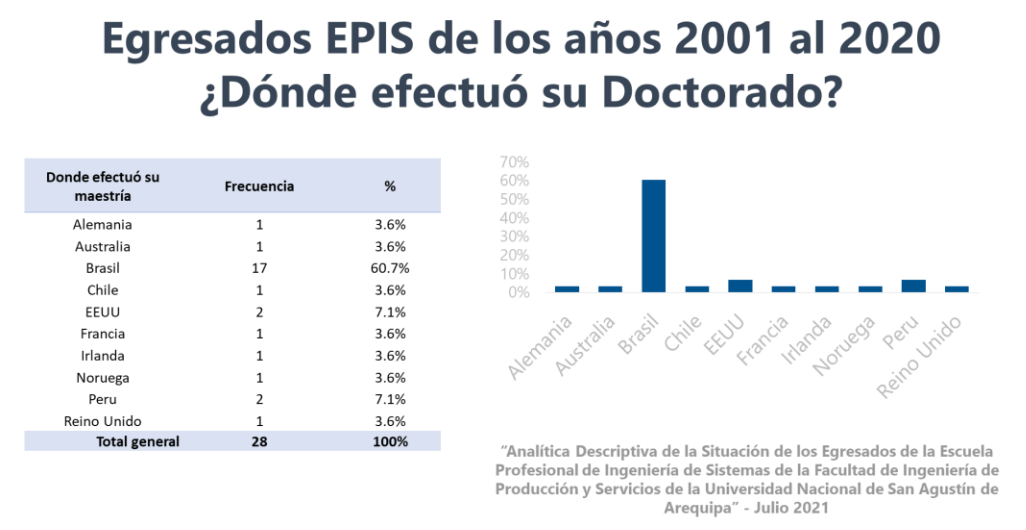
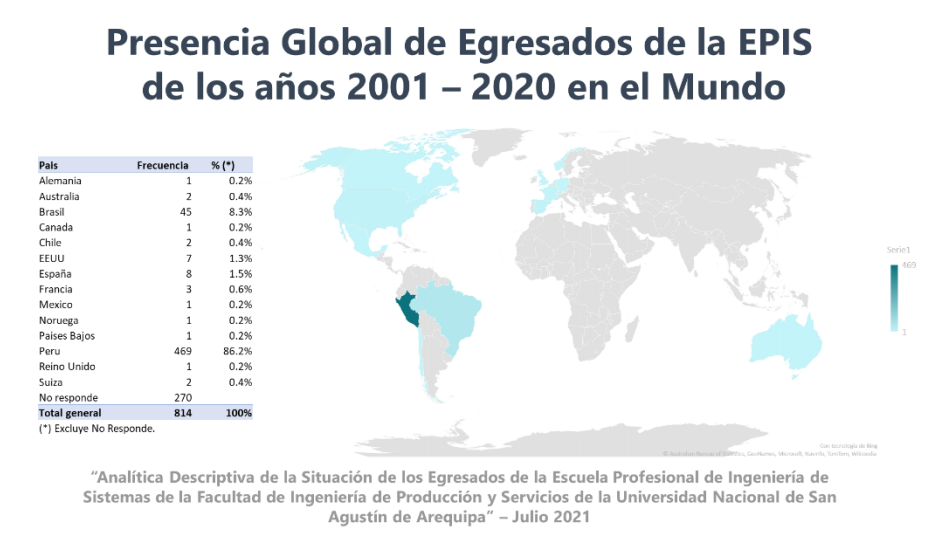
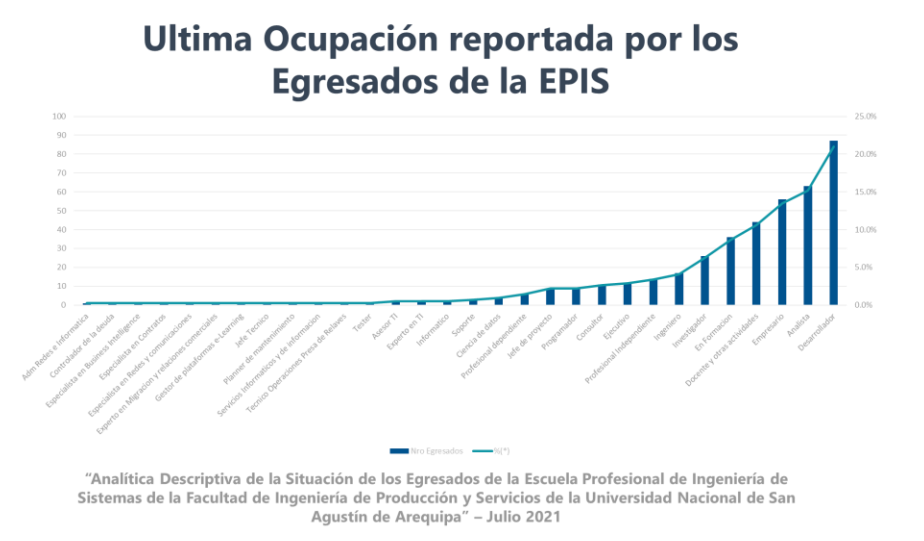
Descriptive Analysis of the Situation of Graduates of the Professional School of Systems Engineering.
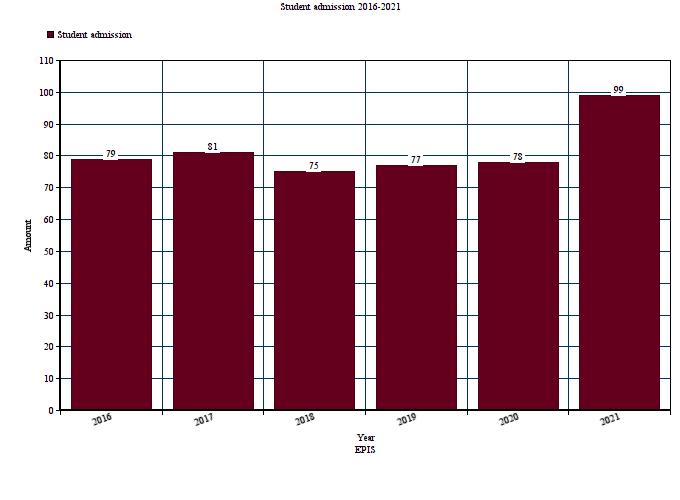
Student admission amount
Year |
2016 |
2017 |
2018 |
2019 |
2020 |
2021 |
Amount |
79 |
81 |
75 |
77 |
78 |
99 |
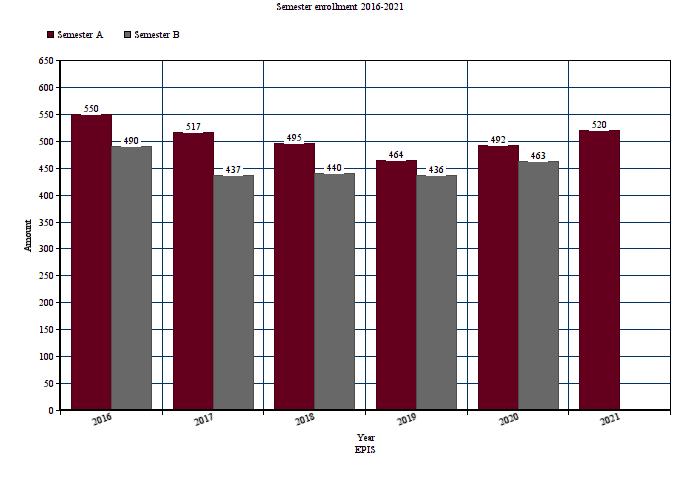
Semester enrollment total
Year |
2016 |
2017 |
2018 |
2019 |
2020 |
2021 |
Semester A |
550 |
517 |
495 |
464 |
462 |
520 |
Semester B |
490 |
437 |
440 |
436 |
463 |
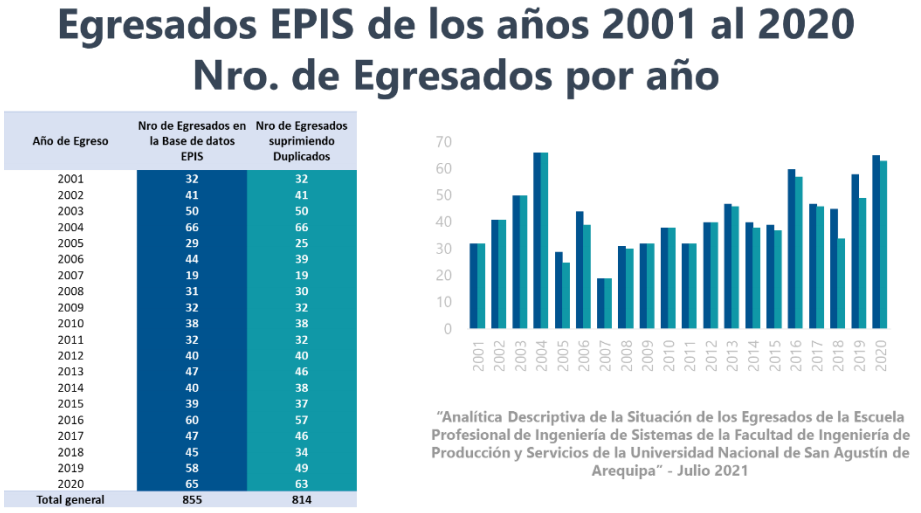
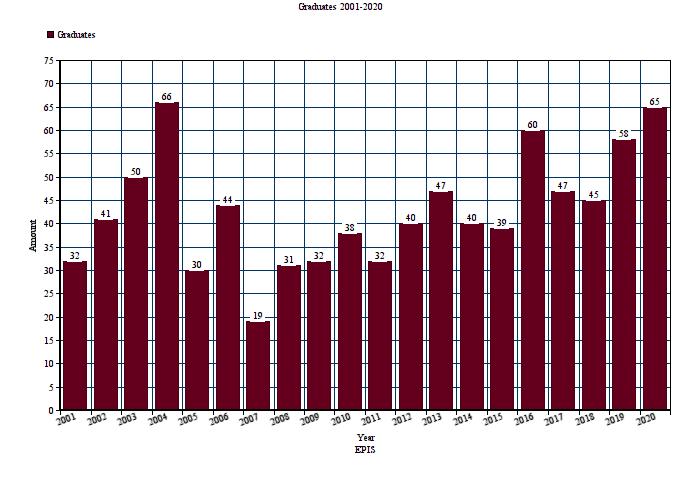
Graduates amount
Year |
2001 |
2002 |
2003 |
2004 |
2005 |
2006 |
2007 |
2008 |
2009 |
2010 |
2011 |
2012 |
2013 |
2014 |
2015 |
20016 |
2017 |
2018 |
2019 |
2020 |
Amount |
32 |
41 |
50 |
66 |
30 |
44 |
19 |
31 |
32 |
38 |
32 |
40 |
47 |
40 |
39 |
60 |
47 |
45 |
58 |
65 |
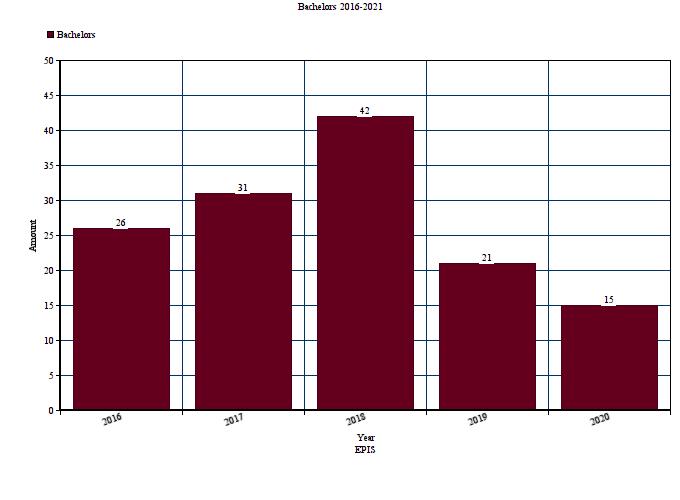
Bachelors 2016-2020
Year |
2016 |
2017 |
2018 |
2019 |
2020 |
2021 |
Amount |
26 |
31 |
42 |
21 |
15 |
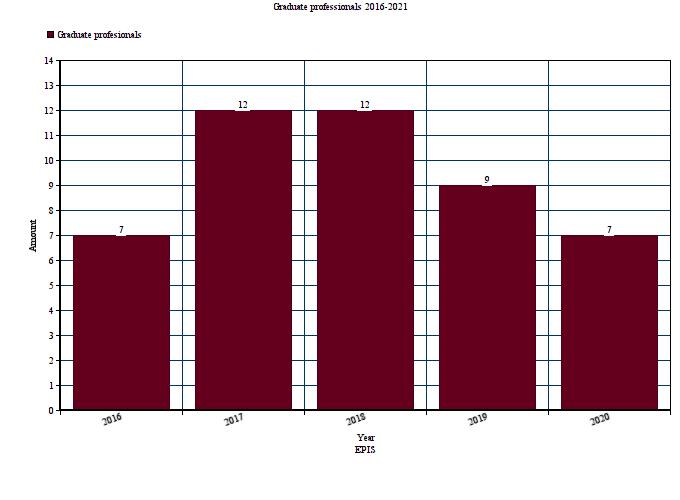
Graduate professionals 2016-2020
Year |
2016 |
2017 |
2018 |
2019 |
2020 |
2021 |
Amount |
7 |
12 |
12 |
9 |
7 |
Other Statistics

